| Common apparatus |
|---|
| Hydraulic system |
| Electronic components |
| Data acquisition |
| EMG monitoring |
| NLID Tools |
| Troubleshooting |
| Materials |
| Supine apparatus |
|---|
| Assembly procedure |
| Safety Measures |
| Components |
| Servovalve |
| Actuator |
| Potentiometer |
| Pressure Filter |
| Torque transducer |
| Boot |
| Literature |
| Computing resources |
|---|
| CVS |
| Ethics |
|---|
| SDS / Inventory |
|---|
Logic Module II
Schematic
This schematic is also available in CDR v.9 format and PDF format
Components
- Parts List (Excel)
- 2N3904 NPN Transistor
- 74F244 Octal Buffers/Line Drivers with 3-STATE Outputs
- LMC567CN Low Power Tone Decoder
- PIC16F84 18-pin Flash/EEPROM 8-Bit Microcontroller
- 30-x Push Button Switches
- SSI-LXH312GD-150 LED, green
- SSI-LXH312ID-150 LED, red
The PIC microcode, along with developmental programs, may be found here: logicmod.zip
Functional Description
The CorelDRAW v.9 file used to make this template is: faceplate.cdr
This module controls the solenoids that pressurize the hydraulic lines, and allows fluid to reach the hydraulic actuator(s) in one of two experimental apparatuses. Though the user must manually press buttons on the module to turn on the solenoids (also called 'valves') the module will automatically turn them off should operating conditions warrant such action.
To determine whether the valves may be turned on - and be allowed to stay on
- the module monitors the state of the hydraulic pump, a panic status input,
and a 'heartbeat' signal from the hydraulic control system. Should the pump
be turned off, a panic state be reported, or the hydraulic controller stop sending
a heartbeat the module shuts off the fluid flow and may also depressurize the
hydraulic lines. (Operating details may be found in the State
Transition diagram.)
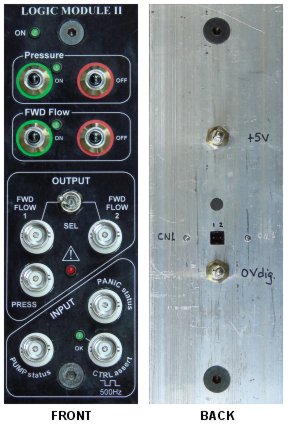
Cable Connections
Input Section:
- Connect PUMP status input to Hydraulic Pump Control Panel Pump Status Out
- Connect PANIC status input to Panic Control Module Panic Status Out
- Connect CTRL assert input to xPC Target machine TTL digital output
Output Section:
- Connect FWD FLOW 1 output to Valve Drive Module input 1
- Connect FWD FLOW 2 output to Valve Drive Module input 3
- Connect PRESSure output to Valve Drive Module input 2
Back of Module
Connect CN1 to a designated digital input on the xPC Target machine controlling the hydraulic system.
Operating the Module
When power is first applied to this module the PIC microcontroller goes through a power-up sequence. (The duration of the power-on-reset varies between 28-132 ms. This excludes other factors such as oscillator start-up time that will only lengthen this period.) During startup the outputs of the module are undefined and equipment under control may be subjected to transients. Hence, this module should be powered up prior to the equipment under its control. After the module has powered up:
- Select the experimental apparatus you will be using via the SEL toggle switch
- Verify that OK LED is illuminated on Panic Control Module
- Turn on the hydraulic pump via the Hydraulic Pump control panel
When the Pressure ON button is depressed the PRESSure output is activated (goes TTL HIGH.) This activates the pressure valve (and valve-X), through the Valve Drive Module, which builds up pressure in the large accumulator in the hydraulic cabinet. Wait for the pressure in the accumulator to reach maximum level (as set on the pump) by reading the pressure gauge on the accumulator.
To proceed further, the xPC Target computer must be running a hydraulic control model in which the designated digital output line, driving the CTRL assert input, is generating a 500Hz 'hearbeat' signal. The module confirms this condition by turning on the OK LED. (The heartbeat signal must be continuously generated.)
At this stage, by pressing the FWD Flow ON button either the FWD FLOW 1 (supine ankle setup) or 2 (standing ankle setup) output is activated (TTL HIGH) depending on the position of the SEL toggle switch.
The (red) invalid operation LED lights up when an invalid operation has occurred, and both PRESSure and FWD FLOW valves are shut off. To clear this condition depress the Pressure OFF and FWD Flow OFF buttons simultaneously.
State Transition Diagram
The state transition diagram below describes the operation of the logic module under all input conditions. When the module powers-up the machine starts at state 00, in which all outputs are LOW. For example, in a normal hydraulic start-up sequence the state machine would transition as follows: Power up -> Standby (pressure valve on) -> Working Mode (pressure and forward flow valves on). A panic condition would then change the state to Invalid Operation (all valves off but Invalid Operation LED on). Panic conditions are context sensitive and do not always set the state to Invalid operation. Shutting off the pump, however, always resets the state to Power up.
![]()
This diagram is also available in CorelDRAW v.9 format and PDF format
The state transition table used to program the PIC microcontroller was setup as an MS Excel (2003) file. That file is available in the ZIP file containing the PIC microcode, or as this PDF document.
Circuit Description
The Microcontroller
U1 runs the program, or microcode, that determines the module's behavior. R4 and C2 set the clock frequency which determines the rate at which U1 executes instructions. The clock rate was experimentally determined to be 66kHz, which translates to 98 decisions/sec being made by the microcontroller.
Weak pull-up resistors are activated internally to U1 on Port B (pins 6-13). Hence, by default RB0 and RB2 read as logic HIGH since these lines are grounded via normally-open push button switches. RB1 and RB3 are grounded via normally-closed push button switches, and read as logic HIGH only when a respective button is pushed.
Port A of U1 is the output port. RA0 (pin 17) and RA1 (pin 18) are the pressure and forward-flow outputs, respectively. These lines are normally LOW and only become HIGH when pressure or forward-flow are on.
Switch SW1 directs the forward flow signal to one of two flow valves; the output to the inactive valve is grounded.
R12, R13, and Q1 invert the signal from RA0 (i.e., the components perform a logical NOT operation.) Hence, connector CN1 outputs a logic LOW signal when forward flow is on, and outputs a HIGH otherwise.
RA2 (pin 1) is normally LOW and becomes HIGH when the microcontroller concludes that an invalid operation has occurred. In such a case, LED5 turns on while both RA0 and RA1 are made to be LOW.
RA4 (pin 3) is the microcontroller's 'heartbeat'. The microcontroller executes a program that is a continual loop, reading the input port and computing the resulting output. At the end of each loop pass the output logic level at the pin 3 is toggled. Experimentally, the heartbeat was measured to be 49Hz. While U1 is executing its program properly LED3 appears to be constantly on.
Jumper J1 can be used to bypass the output from the circuitry that monitors the Control Assert input. Under normal operating conditions J1 is in position 1. In bypass mode J1 is in position 2, causing the microcontroller to think that the hydraulic control system is always on.
The Tone Detector
U3 is a tone detector. The output (pin 8) is an electronic switch with one end connected to ground. When a signal at the input (pin 3) is of a frequency within a window the output switch closes (i.e. pin 8 is shorted to ground.) The 'center frequency' is the frequency to be detected and lies about midway in the aforementioned window. The center frequency is set by R11 and C9, and is setup for detecting a 500Hz input. The tone detector will detect an input frequency within a window slightly larger than 500 ± 10Hz.
C5, R9 and the 40k input resistance of pin 3 form a high-pass filter of cut-off frequency 295Hz. As a result a 500Hz input square wave appears distorted at pin 3. Originally the components were chosen as C5 = 68nF and R9 = 162k to allow a 10% sag of an ideal input square wave, at pin 3. However, the tone detector responded sporadically for input tones of 156.7Hz and 100Hz, since the 3-rd and 5-th harmonics, respectively, were 500Hz. C5 and R9 were then experimentally adjusted to their current values to filter and attenuate the signal at pin 3 to avoid the problem.

The tone detector section was tested with a 500-Hz tone burst (ch1 in the oscilloscope
capture shown here) using an HP3314A signal generator. Note that the figure
is an envelope recording: The 'scope was setup to record the envelope (min and
max values) of a waveform while the circuit was repeatedly excited with a tone
burst of 220 cycles.
At the onset of the tone (~132ms into trace ch1) the detector locked onto the input, in the worst case, 312ms later as shown by a constant LOW on ch2 (pin 8 of U3.)
Of more importance is the behaviour of the detector when the tone stops, at time ~572ms. In the worst case, the detector reacted ~53ms later, as shown by a constant HIGH on ch2. (Test performed on May 16, 2007 on prototype using U2 and U3.)
Printed Circuit Board
The above diagram is available in PDF format and in its original PCB123 V2 format.
Note: The above circuit board is version 2, though the module actually contains
version 1 of the board with a few modifications. (Version 1 board modifications:
Corrected wiring of LED3, and added Q1 and R13.) Hence, the schematic
diagram above is valid for the actual module as well as for board version
2.
Faceplate CAM File
The component mounting holes may be machined on a prepared faceplate
base using this Mastercam X file.
Last modified: 2007-06-08 Ross Wagner